Google Cloud Monitoring using a Storage Bucket as an Example
Monitoring refers to Operational Metrics, as opposed to traditional logging, which refers to audit trails.
In AWS, the logging (CloudTrail) is a separate service from the Monitoring (CloudWatch, Cloudwatch Events and Cloudwatch Alarms)
In GCP, although there is a separation of Logging and Monitoring, the two are joined at the hip. In order to even start looking at Operational Metrics, one has to first enable the logs (specifically, the data access logs) for that service.
Logs - Data Access Logs, Cloud Audit Logs,
Step 1 - Enable Data Access Logs on Cloud Storage
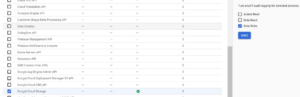
Step 2 - Define a Log Based Metric on your Log Entries (e.g. You want to get alerted on any new objects added to an existing storage bucket)
Now that you have enabled data access WRITE logs, you will start seeing these log events in Cloud Logging.
To configure a METRIC based on these log entries, you will need to define a filter. The filter (basically a QUERY) will contain
a) The name of your bucket
b) The name of the logging API - e.g. - if you are looking for cloud audit logs - logName:"cloudaudit.googleapis.com"
c) The name of the event - e.g. methodName = storage.objects.create
Here's an example of a cloud storage bucket and the corresponding logname -
resource.type="gcs_bucket" AND logName:"cloudaudit.googleapis.com"

Here is the complete log query corresponding to the filter we are trying to define:
resource.type="gcs_bucket" AND resource.labels.bucket_name = "my_storage_bucket" AND protoPayload.resourceName = "my_parent_project" AND protoPayload.methodName = "storage.objects.create"
Visit Google docs for more sample log queries
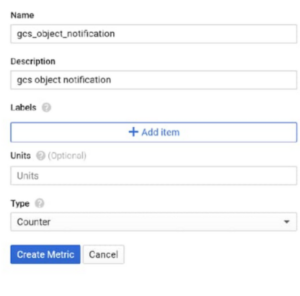
Step 3 - Create a metric with units counter (since all we are doing is counting the writes), and the filter defined above.
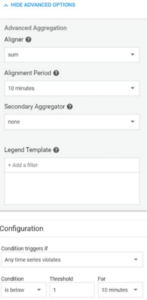
Step 4 - Now comes the fun part. Define an ALERT based on a threshold, so you can get notified whenever the threshold is exceeded.
Say this is a frequently updated bucket, and you would like to be alerted anytime there is a 10 minute gap (lapse) in writes to the bucket.
Summary
Metrics work a little differently in GCP than they do in AWS. Log Metrics are based on log entries, which may or may not be enabled for the service and event type of interest. For example, all data access logs are disabled by default, whereas system event logs and admin logs are enabled by default.
Need a hands-on GCP Consultant?
Set up a 1 on 1 appointment with Anuj to assist with your GCP cloud journey.
Need an experienced AWS/GCP/Azure Professional to help out with your Public Cloud Strategy? Set up a time with Anuj Varma.
Leave a Reply